Sunday, December 16, 2012

Earnings Preview 12/17-12/21


Wow, I cannot believe it has been two months since I have last posed, what a busy semester this has been, but I would not take it back for all that I have learned. Working with our school energy hedge fund this year and doing trades has given me first-hand experience of what it truly means to be in the market. Watching news releases come out, then writing up reports and ideas to enter and exit positions based on the bullishness or bearishness of the release. While doing this, I have not been able to update my blog weekly.

From my last update, the markets have been under some pressure, especially after Obama's re-election earlier last month.  The S&P and Dow are both down 2% and NASDAQ down over 3%, but all are still up 12.5%, 7.5% and 14% year to date respectively. 


Above, a 2 month chart of Dow, S&P, Nasdaq

Apple has been putting downward pressure on the Nasdaq for nearly the past three months, approaching levels that are nearly $200 off of its all-time high. With slower revenue growth forecasted and margin compression from Samsung's line of phones, Apple investors are getting a bit nervous to close out the year. At its high in mid-September, it was up over 72%, it has now given back more than half of that gain, and currently sits 25% above its close at the end of last year, which is still a sizable gain. I expect there will continue to be an unwind of Apple shares as we close out the year, I would anticipate they will have a YTD gain of just around 20% which still is not too shabby.

It was reported on Friday that Wal-Mart has put various Apple products on sale, including the iPhone 5, marked down to $127. This would be a whopping $72 discount to where it has been selling and mind you, these have only been out on the market for a few months. Are there some red flags being raised here about their sales of the iPhone5? Maybe their share price is telling the story. 


Above is a Year-to-Date chart of Apple.

I mentioned CSX would be an under performer this year, especially after its report in October. Since then, its share price has taken an 8% dive. Its earnings report showed net income was 10% lower than its previous quarter ($455M v $512M) which is its lowest profit reading in nearly two years. Because they are so heavily involved in the coal sector, and with Obama being re-elected, this company will struggle for the next few years. Union Pacific is definitely a stronger rail play with hardly any coal exposure, transporting consumer and everyday needed essentials along with cyclical items, and growing profit margins for the past 5 quarters.


Looking at the week ahead as far as macro data:

Monday:

8:30 AM EST Empire State Manufacturing Survey
prev -5.22  Concensus 0.0  (Range -7.0  to 8.5)


Tuesday:

10:00 AM EST Housing Market Index
prev 46  Consensus 47   (Range 45  to 49)

Wednesday:

8:30 AM EST Housing Starts
Starts   prev 0.894 M     Consensus 0.865 M     (Range 0.840 M to 0.940 M)
Permits  prev 0.866 M    Consensus 0.875 M    (Range 0.845 M to 0.914 M)


Thursday:

8:30 AM EST GDP
Real GDP             prev 2.7 %  Consensus 2.8 %  (Range 2.6 % to 3.0 %)
GDP price index   prev 2.7 %  Consensus  2.7 % (Range 2.7 % to 2.8 %)


8:30 AM EST Jobless Claims
Prev 343 K  Consensus 359 K  (Range 345 K to 395 K)


10:00 AM EST Existing Home Sales
Prev 4.79 M   Consensus 4.900 M  (Range 4.600 M to 4.960 M)
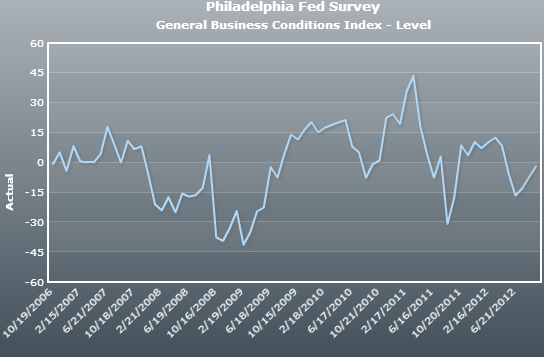

10:00 AM EST Philadelphia Fed
Prev -10.7  Consensus -2.0  (Range -12.4  to 15.0)


Friday:

8:30 AM EST Durable Goods
New Orders  Prev 0.0 %        Consensus 0.5 %  (Range -1.5 % to 2.2 %)
Ex-transportation  Prev 1.5 % Consensus 0.2 % (Range -1.0 % to 0.7 %)


8:30 AM EST Personal Income and Outlays
Personal Income Prev 0.0 % Consensus 0.3 % (Range -0.1 % to 0.8 %)
Consumer Spending  Prev -0.2 %  Consensus 0.4 %  (Range 0.2 % to 0.7 %)
PCE Price Index  Prev 0.1 % Consensus -0.2 % (Range -0.3 % to 0.2 %)
Core PCE price index Prev 0.1 % Consensus 0.1 % (Range 0.0 % to 0.2 %)


10:00 AM EST University of Michigan Consumer Sentiment
prev 74.5  Consensus 75.0  (Range 64.9  to 82.0)


Major earnings for the week ahead:

Tuesday: Oracle
Wednesday: Bed Bath & Beyond, Fedex, General Mills, Paychex
Thursday: ConAgra Foods, Darden Restaurants, Discover Financial, KB Home, Micron, Nike, Red Hat, Research in Motion
Friday: Walgreens

I will be looking at: General Mills, Discover Financial and Walgreens

(via Google) General Mills is a manufacturer and marketer of branded consumer foods sold through retail stores. The Company is also a supplier of branded and unbranded food products to the foodservice and commercial baking industries. The Company manufactures its products in 15 countries and markets them in more than 100 countries. The Company's joint ventures manufacture and market products in more than 130 countries and republics worldwide. General Mills operates in three segments: U.S. Retail, International, and Bakeries and Foodservice. In addition, the Company sells ready-to-eat cereals through its Cereal Partners Worldwide (CPW) joint venture.

Looking at General Mills past five reports, there is nothing that seems to be alarming. I believe that the company will continue to perform well through 2013 as a consumer staple. They are expected to report FY 2013 second-quarter EPS of 79 cents on revenue of $4.88 billion, compared with a profit of 67 cents per share on revenue of $4.62 billion in the year-ago period. They are up nearly 2% YTD and trading close to all-time highs as of close Friday. They underperform the XLP Consumer Staples Sector Spider and Kellogg, which are both up over 10% YTD. 


Above, Recent income statement of General Mills and General Mills compared to Kellogg and XLP ETF

(via Google) Discover Financial  is a direct banking and payment services company. The Company operates as a bank holding company and a financial holding company. The Company operates the Discover Network, its credit card payments network; the PULSE network (PULSE), its automated teller machine (ATM), debit and electronic funds transfer network, and Diners Club International (Diners Club), its global payments network. It operates in two segments: Direct Banking and Payment Services. Its Direct Banking segment includes Discover card-branded credit cards issued to individuals and small businesses on the Discover Network and other consumer banking products and services, including personal loans, student loans, prepaid cards and other consumer lending and deposit products offered through its Discover Bank subsidiary.

Discover has been on an absolute tear this year, up 65% YTD but I believe there is more room to run for this name. With a current P/E of 9.9, well below Visa at 23, American Express at 13 and MasterCard at 23.7, it is very cheap fundamentally. They are expected to report FY2012 fourth-quarter EPS of $1.11 on revenue of $1.96 billion, compared with a profit of 95 cents a share on revenue of $1.81 billion in the year-ago period. The story here is consumers using plastic for payment instead of paper. The way I see it is plastic is the way of the future, more people will be using credit/debit cards and these card companies will scoop up all of the revenue from this. The high-end consumer is and has been back, we have seen this from the past Black Friday reports, as well as luxury retail performing very well.

If you have been in this name for a while, do not be greedy as it has had a phenomenal year. Take profits if you are uncertain, there is no harm in doing so. The way I'm seeing it is that DFS is trading at cheaper valuations, and has outperformed all of the other card companies this year, it is hard to say where I think it will go.


Above, a year to date performance of Discover Financial, comparing it to American Express, Visa, and MasterCard.

Last, Walgreens which together with its subsidiaries, operates the drugstore chain in the United States. The Company provides its customers with access to consumer goods and services, pharmacy, and health and wellness services in communities across America. The Company offers its products and services through drugstores, as well as through mails, by telephone and online. The Company sells prescription and non-prescription drugs, as well as general merchandises, including household items, convenience and fresh foods, photofinishing and candy.

They have been an under performer to the overall market this year, but are on my radar to be a top performer for 2013. Comparing them to CVS and the Healthcare Sector Spider XLV, they are under performing both by 10% and 7% respectively. Walgreens net income has nearly been cut in half since last August due to a decline in revenue. Comparing them to CVS, their net income has grown 20% since that time. The P/E ratio of both companies are relatively the same.

I believe the healthcare sector as a whole will continue to outperform the overall market in 2013, with Walgreens to rebound. I am looking for a strong report and shares to move higher toward $40 into 2013.


That is all for this week, Follow me on twitter @Peter_Eller10 as well as our school energy hedge fund @SIMMenergyfund.


Monday, October 15, 2012

Preview of Macro/Earnings for week of 10/15-10-19


As we get closer to the presidential election, we are seeing the broader markets begin to weaken a considerable amount, mainly led down by technology, and industrial sectors. Global growth continues to slow and equity markets are beginning to notice.

The week in review:
Dow -2.07%
S&P -2.21%
Nasdaq -2.3%

Apple (-3.51%)  once again ended lower for the week, extending its losing streak to now 3 weeks. This is the first time since last November Apple has been down 3 straight weeks, and is now in correction territory ( -10.6% off its all time high)


Above the broader markets for the week, as well as Apple.

Earnings reports from last week mainly all beat and surprised to the upside. Alcoa was the only one I was really concerned about, and though they beat on top and bottom line, looking internally at ther numbers, there are signs that aluminum demand is still not there.

Excluding one-time special items (a $175 million charge for the settlement of a civil lawsuit against Aluminum Bahrain), Alcoa earned $32 million or 3 cents a share in the quarter. Revenues decreased 9.1% year over year and to $5.83 million, but were ahead of consensus estimate of $5.56 million. Alcoa said that aluminum prices dropped 17% year over year in the third quarter. Investors reacted negatively to this news, sending Alcoa in the red for the week down 4.4%. As global PMI numbers continue to come in weaker than expected, we will continue to see Alcoa shares under perform the broader market.

YUM Brands which reported Tuesday as well beat expectations on both top and bottom line. They reported Q3 '12 earnings of 99 cents per share, ahead of the 97 cents consensus. Earnings jumped 19% year over year,  driven by strong performance at all of their divisions.

They reported a 9% yoy increase in total revenue to $3.56 billion from sales growth in China, Yum! Chinese sales were up 22%, Yum Restaurants International as well up 4% and the US sector up 1%.  The largest sales growth came from Yum Restaurants India which saw a considerable 29% increase.

Comps improved 6% in China, 2% in the International division and 6% in the U.S. division. There were comps increases of 7% at Taco Bell, 6% at Pizza Hut and 4% at KFC. Comps were also up in the India division gaining 5%.
YUM also did a share repurchase during the quarter; 6.5 million shares at $64.00 as well as raising full-year guidance on an EPS basis from 12% to 13%.

Investors reacted positively for this news, as YUM finished up 5.23% on the week.

Costco  reported earnings on Wednesday, beating EPS and Revenue consensus estimates as well. EPS came in at $1.39 per share compared with $1.08 reported last year, and revenue jumped nearly $4B from last year's reported revenue of $27.59B to $31.52B. Their fiscal Q4 net income jumped up 27% as both net sales and overall sales were up 14%.

Sales jumped to $32.22 billion as compared to $28.18 billion a year ago. Same-store sales for the quarter were up 5%, with a 6% jump in US sales and 2% increase worldwide.

Costco extended its gains to an all-time high on this news, but soon pulled back toward the end of the week as the broader market extended its downward streak. They finished the week down 4.17% but look to have the growth prospects to help them out for the next few years.

Looking ahead for this week, we have a considerable amount of macroeconomic data being released, which will be key factors for market direction as we near the fiscal cliff and the presidential election.

Monday:
8:30 AM EST Retail Sales
Retail Sales Prev 0.9 % Consensus 0.7 % (range 0.4 % to 1.3 %)
Retail Sales less autos Prev 0.8 % Consensus 0.5 % (range 0.0 % to 1.1 %)
Less Autos & Gas Prev 0.1 % Consensus 0.5 % (range 0.3 % to 0.5 %)


8:30 AM EST Empire State Mfg. survey
Prev -10.41  Consensus -3.0  (range -6.5  to -1.0)


10:00 AM EST Business Inventories
Prev 0.8 % consensus 0.5 % (range 0.2 % to 0.6 %)


Tuesday:
8:30 AM EST Consumer Price Index
Prev 0.6 % Consensus 0.5 % (range 0.3 % to 0.6 %)
Less food and energy Prev 0.1 % Consensus 0.2 % (range 0.1 % to 0.2 %)


9:15 AM EST Industrial Production
Production Prev -1.2 % consensus 0.2 % (range 0.0 % to 1.0 %)
Capacity Utilization Rate Prev 78.2 % Consensus 78.3 % (range 78.0 % to 79.2 %)
Manufacturing  Prev -0.7 % Consensus 0.1 % (range-0.3 % to 0.5 %)

10:00 AM EST Housing Market Index
Prev 40  consensus 41  (range 40  to 43)

Wednesday
8:30 AM EST Housing Starts
Starts Prev 0.750 M Consensus 0.765 M (range 0.745 M to 0.785 M)
Permits Prev 0.803 M Consensus 0.810 M (range 0.799 M to 0.843 M)


Thursday:
8:30 AM Jobless Claims
Prev 339 K Consensus 365 K (range 360 K to 385 K)
There was some talk last week about this big drop in claims, so this week's number will be key to see if the results are actually true.

10:00 AM EST Philadelphia Fed
Prev -1.9  Consensus 0.5  (range -2.0  to 5.8)


10:00 AM EST Leading Indicators
Prev -0.1 % Consensus 0.2 % (range 0.0 % to 0.5 %)

Friday:
10:00 AM EST Existing Home sales
Prev 4.82M Consensus 4.750M (range 4.530M to 4.820M)


On the earnings calendar this week, I will be previewing:
Tue: Coca-Cola, CSX
Thur: Fifth Third Bancorp, Verizon

Coca-Cola, which reports Tuesday, is a consumer beverage company. They own or licenses and market more than 500 nonalcoholic beverage brands, primarily sparkling beverages but also a variety of still beverages, such as waters, enhanced waters, juices and juice drinks, ready-to-drink teas and coffees, and energy and sports drinks. It owns and markets a range of nonalcoholic sparkling beverage brands, which includes Coca-Cola, Diet Coke, Fanta and Sprite. (via google)

Analysts expect a slight decline in earnings this quarter, as higher ingredient costs hinder their profit margin. Looking forward, they are seeing 10% growth through 2013, so this appears to be a one-time event. With the US dollar weakening, I expect to see international sales, especially in Asia and India, do very well.

Comparing Coca-Cola to its main rival Pepsi, they have outperformed them YTD by 3.7%. Coca-Cola is up 9.3%, while Pepsi is up 5.6%. The past two quarters, their profit margin is up from 15% to 21.3% on strong Revenue growth. Net Income was up nearly 40% q/q from its last report. Compare this with Pepsi, who have seen revenue drop from 20 Billion in Q4 '11 to 16.45 Billion in their last report; though they were able to better control expenses, as net income was relatively unchanged. Coca-Cola, though having a lower dividend yield than Pepsi (2.67% v 3%) and higher p/e multiple (20 v 18) has better long-term guidance and growth prospects. They have a wider market share globally, with more products for consumers to choose from. 


Also reporting Tuesday is CSX. They are a transportation supplier that provides rail-based transportation services, including traditional rail service and the transport of intermodal containers and trailers. The current  consensus estimate for the third quarter is 44 cents per share, with annualized growth of 1.84%. In their last report on July 18, 2012, they reported EPS of 49 cents per share just beating the consensus of 47 cents per share. Earnings increased 7% year over year from 46 cents by higher revenues from coal exports, and automotive transportation. Revenue remained fairly flat year over year at 3.01 billion; operating income grew 2% year over year in the second quarter to $943 million, boosted by effective cost control and improving productivity.

I remain skeptical on CSX, as we have seen all of the names in the coal sector, hover near all time lows. With Obama's administration and clean energy policy, coal usage has been at all time lows, with prices to stay low as well for some time. CSX is the largest transporter of coal in the rail sector, and with Norfolk Southern dropping a bomb of an earnings report last month, rail transportation may be beginning to slow.


Thursday, one of my long-term holdings Fifth Third Bancorp reports earnings. They are expected to show 39 cents a share EPS, with a revenue number pretty much in line from last quarter. There have been no big surprises to the upside or downside for FITB, with steady revenue growth still persisting since '08. The only big news is they plan on raising their dividend again, announced late last month.  After receiving a TARP payment from the US gov't they had to keep their dividend for '09-'10. They soon increased it to 6 cents in '11 and now it is currently at 10 cents, yielding 2.62%. Shares are at 4 year highs, but well off their all-time high of  over $60.00. I expect them to grow, though slowly through the next few years as they unwind from their toxic assets and into safer investments.


Comparing FITB to the KBW index, and the S&P, they have outperformed the S&P by 7% but lagged the KBW by 7%. While boasting a higher dividend in the near future and continued revenue growth, this seems like a safe bet long term.

I will also be watching Verizon Thursday, as this is one of my favorite safe high-yielders who have increased their dividend every year for the past 4 years, up 20% in that time period. Telecom has been a hot sector this year as investors seek safety with a steady income stream, but these stocks are not overpriced.  I foresee Verizon having another good report, and possibly hitting $50.00 by year end.

As well as these earnings, I will be watching oil for our energy hedge fund, which you should follow on twitter, @simmenergyfund as well as myself @peter_eller10. Have a good week everyone. 


Monday, October 8, 2012

Previewing the 1st week of Q3 earnings


Wow, it has been a long time since my last post, but I have nothing to regret about what has happened in the past month. School has been busy, finally getting into my core classes along with getting the real-world experience I need for my future career. I took up an analyst position in the WTI sector of our energy hedge fund at the beginning of the school year, where I am constantly tracking oil markets , as well as coming up with potential trade ideas for being long.

Lets catch up from a month ago:

-S&P 500 and Dow have both had good gains up 1.6% and 2.3% respectively. The QE3 hopium has seemed to have fizzled out within the past couple weeks and consolidation is now taking place before we begin the wave of Q3 '12 earnings.

-Nasdaq is unchanged since I last posted, Apple has lagged the market in the past month and is down 7.5% off its all time high from two weeks ago. A couple of reasons:
               
-Via Bloomberg on Thursday night, Samsung Galaxy 3 sales beat expectations. This is the major                 competitor for the iPhone5

-The iPhone5 has gotten some negative reviews on its maps app due to lack of Google maps.    There are also very minimal changes from the iPhone 4s; in my opinion, people were expecting        more.

-Global PMI data released last Monday show that we are still in contraction, and US growth is still sluggish.

-Jobs numbers from Friday were fairly strong, but debatable as seen from Jack Welch's standpoint on how the BLS obtains their data. Nonetheless, politics aside, we are better off than '08 but still nowhere close to where we want to be. 


Above, Dow, S&P, Nasdaq and Apple

Most of the major macro data releases took place in the last two weeks, so we will look to cruise right into Q3 on minimal news unless something breaks midday.

Earnings on tap for this week:

Tuesday: Alcoa, YUM,

Wednesday: Costco

Friday: JP Morgan, Wells Fargo

Alcoa, one of the biggest laggers of the Dow for the past 4 years now, reports Tuesday. From back in July, I mentioned how they would continue to underperform the overall market, unless we see turn around in global manufacturing data. Alcoa is up only 4% in the past 3 months compared to the S&P up 7.5%.  Demand is not there for aluminum and I still continue to see a bleak future going into 2013 for this company. We will have to hear more from CEO Klaus Kleinfeld on the conference call Tuesday afternoon, but I am not expecting any surprising upward revisions. Analysts expect Alcoa's third-quarter results to show it broke even, down from a profit of 15 cents from last year, according to Thomson Reuters. With all of the negativity in China the past quarter, I would not be surprised if they reported a loss. 


Fundamental analysis of Alcoa show that the company is weak internally. They continue to fluctuate between net profit and net loss from quarter to quarter, mainly due to the costs. Revenue is stagnant and has been for the past 3 quarters (between 5.9B and 6B dollars) so revenue growth is an issue as well. They have also lost over 1.3B in retained earnings over the past year.


Technical Analysis shows a buy on a recent golden cross and MACD, but I wouldn't put much into this.
YUM Brands also reports Tuesday; looking at them YTD, they have outperformed main competitor and global franchise McDonald's by over 20%. In my opinion, one reason is more choice of food. McDonand's has just their burger line, but YUM has Pizza, tacos, and chicken which gives the consumer more of a choice. With 37,000 restaurants in 120 countries, they have a better chance to catch the consumer when they are not in the mood for a burger or other items on the McDonald's menu. Analysts are expecting a profit of 97 cents, up from 83 cents a year ago. Fiscal year earnings are projected $3.26 per share, while revenue is expected to be $3.64 billion for the quarter. This is about 11% higher than the previous year of $3.27 billion. Total revenue for the year is expected to come in at $13.9 billion. They have seen double digit revenue growth on a year over year basis as well.


Above, comparing YUM to McDonalds, we see that YUM is clearly the outperformer

Looking at YUM's fundamentals, their profit margin has had some wild swings in the past year, going from 7.5% to 17.5%. This may have a slight affect on the stock price, but until I see a drastic decline or negative growth in their monthly comps, then this is still a good place to put some money. It is also good to stay defensive in an uncertain economic environment, and a 2% dividend yield is a great way to make some cash while you wait.

On Wednesday, we get a look at Costco's earnings. This has been one monster of a stock to own this year, as well as Wal-Mart which are both up 21.5% and 26% respectively, outperforming the s&p 500, consumer staples sector and consumer discretionary sector. They have been doing well because of their ability to sell gas to consumers at cheaper prices than gas stations, from membership fees. Also, Americans like everything big, and with the ideology that bigger is better; it is also cheaper, especially when buying bulk.
Analysts are expecting a higher profit for Costco when they report  Q4 results. The consensus estimate is for profit of $1.30 a share,  which is up from $1.08 per share a year ago. Analysts are projecting earnings of $3.86 per share for the fiscal year. Revenue is expected to beat  the previous year's total of $28.18 billion by about 12%, ending at $31.59 billion for the quarter. For the year, revenue is projected to come in at $98.52 billion.

Net income has risen three straight quarters. The 19.1% yoy growth in net income in the most recent quarter came after the 13.2% growth in the second quarter and the 2.6% rise in the first quarter.

As seen from the chart below, Wal-Mart is the clear outperformer, but in my opinion Costco has stronger fundamentals and better growth prospects. Wal-Mart's has been bouncing all over the place in the past year. This in my opinion is due to Costco's strong presence in North America, whereas Wal-Mart's North American revenue is 60% of its total revenue (they have stores in 27 other countries).


I believe they will beat on both top and bottom line, but the shares may get hit as they have not had a decent correction down in quite some time.

On Friday, both of the big banks JP Morgan and Wells Fargo report earnings, JP Morgan at 7:00AM EST and Wells Fargo at 8:00AM EST. For Wells Fargo Q3, analysts are looking for earnings of $0.87 per share, with a high-low range of $0.80 to $0.94. Earnings have only missed once in the past three years. Revenues are projected to rise 9.10% yoy to $21.42 billion.

Credit Suisse expects the big banks to deliver solid third quarter earnings, including Wells Fargo. The firm cited loan growth and asset quality as drivers for the group.

For JP Morgan, they are expected to earn $1.22 per share range on revenue of $24.55 billion, a slight increase (0.70%) from the previous year. JP Morgan is now trading at 9.64x earnings well below the 5-yr average of 16.9x. The shares are also trading at a discount to book value of $48.70(as of the last report) Shares are up about 20% since disclosing a 2 billion dollar trading loss in its CIO unit on May 10th.
In recent news, they were sued over Bear Sterns  role in the 2008 financial crisis of misleading investors through the sale of MBS that had the high potential for default.

I have no positions in large banks, and do not plan on buying either here, the rough macro conditions and central banks keeping rates low till 2015 should tell you to stay away as well.

I will be watching oil markets this week and throughout the rest of the year as well. I tweeted out a screenshot of light sweet crude futures last week of a potential breakdown that we could see in the near term


You can follow me on twitter @peter_eller10 and our energy hedge fund, updated daily @SIMMenergyfund  have a good week all.  


Monday, September 10, 2012

A different kind of September?


Is this September going to be different?

-In the past two weeks we have seen some big moves up in the equity market as continued slow growth means another round of easing. Manufacturing data in the US as well as worldwide are still signaling contraction as well as a slow employment picture. 

-On Friday, the Bureau of Labor Statistics released a +96,000 job increase for the month of August, well below analysts' expectations of 130,000. We can see from the deceleration of labor force as well that more people are becoming discouraged and dropping out to try and find an opportunity. Baby boomers are beginning to retire, but corporations are on a tight budget and are not hiring new people to replace them. I believe that this is the beginning of something new for big businesses, the labor force will continue to shrink as businesses use robots and machines to do the work humans have done. Why wouldn't they? It is a onetime fixed cost and you don't have to pay them on days off.

-Here is proof, the story is a couple years old, but it gets the point across: http://singularityhub.com/2010/04/05/5-axis-robot-carves-metal-like-butter-video/

-Earnings reports have had a mixed picture. We continue to see  strength in some of the consumer discretionary names while the strongest sector is consumer staples.
A review  of the last post:

-Heinz beat expectations growth in emerging markets, improved sales in North America and Australia, sales growth of 4.8% EPS was .87 a share vs .81 estimate. CEO commented, “despite the headwinds of a still weak economy and adverse foreign currency trends that reduced EPS by around four cents. Overall, our strong first-quarter results put Heinz on track to deliver our previously announced outlook for Fiscal 2013.” Not surprising at all, being heavily invested in North America and Australia, is where to be despite slow growth, it is better than Europe.
-Joy Global lowered its '12 outlook on slowing in China and weak US coal demand. Shares closed down 5% on the day the report came out, but has since rebounded strongly, up more than 10% along with the rest of the broad market on news of continued easing in Europe. CEO Mike Sutherlin does say he sees a bottom forming in the US and China manufacturing sector, but the recovery will be very sluggish, and could take years to be back to where it was post '08. Bookings fell 25% to $1.1 billion during the quarter, compared with the same 2011 period. Joy Global said commodities demand has slowed forcing its customers to cut capital expenditures, reduce overhead and trim production. Joy Global shares have been hard hit this year, trading down 48% from a 52-week high of $96 touched on Jan. 26.
-As I expected, Frontline once again missed its quarterly estimates, they were down -10.84% to $3.29 after releasing second quarter results.  Net loss was $11.2 million or loss per share of $0.14 compared to net income of $7.2 million or earnings per share of $0.09 in the first quarter. The Company had total cash and cash equivalents of $177.1 million as of June 30, 2012, market price is currently 30% above its cash per share price which is roughly $2.24. Costs on maintenance of all the tankers are hurting top and bottom line, this will continue to be a problem going forward.
-oil and gold have both had big runs in the past 2 weeks as weak data paints the picture for more Quantitative Easing from the Federal Reserve. If Obama is reelected, which as of right now it is looking to be the case, then we will probably get another round of easing.
Below, a chart of gold and oil futures $GC_F $CL_F performance this year.

Notice the gold breakout of the wedge, which was on the Jackson Hole speach, as well as oil, which was in danger of a breakdown Friday coming close to the 94.00 level, but bounced off and retraced up to 97.00 by pit close. Both to me as I see it remain in a long-term uptrend, oil looks more bullish to me than Gold, since it is more sensitive to monetary policy than oil.

Macro data this week is as follows:
Monday:
3:00PM EST Consumer Credit
prev. $6.5 B Consensus $9.8 B (Range $5.0 B to $14.9 B)
The dollar value of consumer installment credit outstanding. Changes in consumer credit indicate the state of consumer finances and portend future spending patterns. Retail sales were strong in July but motor vehicle sales were down. So there is support for a gain in revolving credit in July but non- revolving credit may be soft unless student loans add lift.


Tuesday:
7:30AM EST NFIB Small Business Optimism Index
prev. 91.2 Consensus 91.5 (range 90.0 to 93.0)

Tuesday:
8:30AM EST International Trade
prev. -$42.9B Consensus $-44.3B (range -$47.1B to -$39.7B)
The trade deficit tends to get wider as the stock market/economy picks up. This means we are continuing to import goods rather than make them here. With a weak dollar, it is cheaper to import foreign goods rather tham manufacture and export American goods. Look for this pattern to continue, as well as drag on GDP, which it has done for the last 30 years.


Wednesday:
8:30 AM EST Import and Export Prices
Export Prices prev. 0.5 % Consensus 0.5 % (range0.0 % to 0.9 %)
Import Prices prev. -0.6 % Consensus 1.5 % (range0.4 % to 1.9 %)
As the dollar has lost a considerable amount of value in the past month, look for prices of imports to become more expensive.

10:00 AM EST Wholesale Trade
prev -0.2 % Consensus 0.4 % (range 0.0 % to 0.8 %)
Measures the dollar value of sales made and inventories held by merchant wholesalers; a component of business sales and inventories.

Thursday:
8:30AM EST Jobless Claims
Prev 365 K Consensus 370 K (range 365 K to 380 K)

8:30 AM EST Producer Price Index
Prev 0.3 % Consensus 1.4 %  (range 0.2 % to 1.8 %)
less food & energy Prev 0.4 % Consensus 0.2 % (range 0.0 % to 0.2 %)
Average change over time in the prices received by domestic producers of goods and services.

12:30 PM EST FOMC Announcement
Prev 0-.25% Consensus 0-.25%
Expect rates to stay low where they have been.

2:00 PM EST Treasuery Budget
Prev. $-69.6 B Consensus  $-160.0 B (range $-175.0 B to $-155.0 B)
Simply put: our government spends more than it takes in, so there will be deficits for a long time, until we get our spending problem under control. Consensus shows that this will be the biggest monthly deficit since March, nothing to be taken lightly.


Friday:
8:30 AM EST Consumer Price Index
Prev. 0.0 % Consensus 0.6 % (range 0.2 % to 0.9 %)
less food & energy Prev. 0.1 % Consensus 0.2 % (range 0.1 % to 0.2 %)
Look for CPI to tick up a considerable amount this month as equities have done quite well along with the depreciation of the US dollar.


8:30 AM EST Retail Sales
Prev 0.8 % consensus 0.8 % (Range 0.3 % to 1.5 %)
Retail Sales less autos  prev. 0.8 % Consensus 0.8 % (Range 0.3 % to 1.5 %)
Less Autos & Gas prev. 0.9 % Consensus 0.4 % (range 0.3 % to 0.8 %)
Looking for little if any change in Retail Sales this month, though yearly percentage change is still in a downtrend as shown below.


9:15 AM EST Industrial Production
Production Prev. 0.6 % Consensus -0.1 % (range -1.0 % to 0.3 %)
Capacity Utilization Rate prev. 79.4 % Consensus 79.2 % (range 78.6 % to 79.5 %)
Manufacturing prev. -0.2 % Consensus (range -0.5 % to 0.2 %)
The Federal Reserve's monthly index of industrial production and the related capacity indexes and capacity utilization rates cover manufacturing, mining, and electric and gas utilities. Not surprising here that industrial and manufacturing are expected to be lower.

9:55 AM EST Consumer Sentiment
prev. 74.3 Consensus 73.5  (range 73.0  to 75.0)

10:00 AM EST Business Inventories
prev. 0.1 % Consensus 0.5 %  (range 0.1 % to 0.6 %)
What I'm watching here is the strong uptick in the inventory-sale ratio we saw last month, whch was the highest since Oct. '09.


As far as earnings reports this week, there is not much going on, as we are seeing the light at the end of the tunnel for Q2 reports. In less than a month, it will be back to square one again, and we will get a read on how corporations did this summer.

I am looking at Pall Corporation this week; they are a supplier of filtration, separation and purification technologies with two market segments: Life Sciences and Industrial. The Life Sciences business group is focused on developing, manufacturing and selling products to customers in the medical, biopharmaceuticals and food and beverage marketplaces. The Industrial business group is focused on developing, manufacturing and selling products to customers in the Energy and Water, Aeropower and Microelectronics markets. This to me can be seen as half discretionary half consumer staple based on where they do their business. A larger portion of their business deals with the industrial side and that worries me. Currently, they are trading at 20 p/e with net income declining from the previous reporting quarters. The big problem here are expenses/costs which are roughly 85% of the company's revenue. Short term and for this quarterly report, I'd be a bit bearish on the numbers, seeing as we had a slow beginning of the year into the summer, but long term, it may recover nicely due to monetary policy.


Above is a YTD Chart of Pall with two of its main competitors, notice Pall's underperformance compared to the two others.

As a side note, the SIMM Boot Camp was held last Friday, was a great time to get to know some alumni, I am seeing a bright future this year for the fund.

Follow @BonaSIMM which is our long fund @simmenergyfund which is our $250K energy hedge fund (both 100% student run). This year I will be an analyst for crude oil, learning how to make trades on calendar spreads.

Have a good week all!


Monday, August 27, 2012

Preview of Macro and Earnings 8/27-8/31


It is getting to be that time of the year again; yes the school year is approaching once again. I have been enjoying the last week of summer with my cross country team here at school and it has been great despite not yet being able to run. I am feeling very optimistic that soon enough I will be back out on the trails, but for now, just a lot of strength training and cross training.

The past two weeks the markets have been drifting up on low volume no news, which seems to be the normal pattern for an upward trend. We are pretty much unchanged in 2 weeks with a very narrow trading range between 1404-1424 in the S&P futures .This past Tuesday into Wednesday, we started to see Europe headlines appearing back on the wires. This brought futures below a key support 1400, though quickly recovered as the day continued. Long-term (10 years out) I believe we will be higher, though near term we will continue to see troubles from Europe as they will widdle their way back into the news. Massive amounts of monetary policy cannot fix bad ficsal policy.

We have a lot of macro data out this week, mainly manufacturing and housing, following a very light past couple of weeks, so this should be one to pay attention to, seeing as the slight bull run we have had in the past 3 weeks seems to be coming to an end.

Monday:
10:30 AM EST Dallas Fed Survey
Prev -13.2 Consensus -6.0 (range -10 to -5)
Survey of about 100 manufacturers in Texas. US Flash PMI last week gave us a read higher than consensus, which has been the 1st time that has happened  in a few months. This tells me that even though global manufacturing growth is slowing, US manufacturing is growing, but stagnant. I still expect a read below consensus on Dallas fed.

Tuesday:

9:00 AM EST Case Shiller Home Price Index
Seasonally adjusted M/M
Prev 0.9 %
Consensus 0.4 %
Range 0.2 % to 1.0 %
Non-Seasonally adjusted M/M
Prev 2.2 %
Consensus 1.4 %
Range 0.9 % to 1.5 %
Non-Seasonally adjusted Y/Y
Prev -0.7 %
Consensus 0.0 %
Range -1.5 % to 1.0 %
After 3 previous months of increased home prices (.9% in May and modest gains in March + April), we still expect to see an increase, but at a slower pace, seasonally adjusted. Housing will continue to be a difficult market to gain traction as supply is still flooding the market.


10:00 AM EST Consumer Confidence
Consumer Confidence 
Prev 65.9 
Consensus 65.8 
Range 63.0  to 68.0 
Expect there to be little change in consumer confidence for the month of August. We can see from the chart below of Retail Sales and Consumer Confidence that they generally move in tandem, and Retail Sales have been slowing for the past year.


 10:00 AM EST Richmond Fed Manufacturing Survey
Prev -17 
Consensus -10 
Range -12  to -7 
Looking to be the same picture as Dallas Fed, look for continued slow growth

Wednesday:

8:30 AM EST GDP
Prev 1.5 %
Consensus 1.7 %
Range 1.4 % to 2.0 %
The second read of Q2 GDP we expect to see a slight uptick, but still below Q1 '12 levels of 2.0%


 10:00 AM EST Pending Home Sales
Prev -1.4 %  Consensus 1.0 % (Range -1.5 % to 3.5 %)
After last months read was revised down due to a shortage of supply (odd),  expect to see a tick up.

Thursday

8:30 AM EST Jobless Claims
Prev 372 K
Consensus 370 K
Range 365 K to 375 K
Expect to see little change in unemployment claims this week as we get toward the end of the month

8:30 AM EST Personal Income and Outlays
Personal Income
Prev 0.5 %
Consensus 0.3 %
Range 0.2 % to 0.4 %
Consumer Spending 
Prev 0.0 %
Consensus 0.4 %
Range 0.2 % to 0.6 %
new motor vehicle sales were down 2.0 percent in July while retail sales excluding autos jumped 0.8 percent, so expect to see a slight jump in consumer spending for this months read.

10:00 AM EST Kansas City Fed
Prev 5 
Consensus 5 
Range -5  to 6 
There was improvement in July, rising to 5 from 3 in June, showing a slightly stronger growth rate, though details were mixed. The production index went  to 2 from 12 in June. New orders did improve, but remained in negative territory, rising to -4 from -7. Expect to see the slow growth continue.

Friday
9:45 AM EST Chicago PMI
Prev 53.7 
Consensus 53.0 
Range 51.0  to 54.5 
 Expect this to follow suit with ISM manufacturing, which is also getting close to contraction, although a preliminary look at PMI last week showed a slight sign of hope.


9:55 AM EST Consumer Sentiment
Prev 73.6 
Consensus 73.5 
Range 73.0  to 75.0 
A small survey done in Michigan with 500 households participating on feelings of economic conditions. Any read above 80 is considered positive sentiment.

10:00 AM EST Factory Orders
  
Prev -0.5 %
Consensus 2.0 %
Range -0.4 % to 2.6 %
 New factory orders have been down in the past few months due largely to the decline in orders in natural gas and coal, where we see too much supply and problems with clean energy respectively. Y/Y we have seen new orders and shipments come back down from highs reached 2.5 yrs ago to about the unchanged level, signaling some tough times are yet to come.


Earnings for the 2nd Quarter are starting to dwindle down as we near the beginning of September, more than 2/3 of the S&P 500 have reported this quarter, mostly a mixed picture with the consumer names (ones I am bullish on) continually beating and raising guidance, while the manufacturing names continue to slow. We are also seeing a big push into the high yield corporate bond market, especially the  HYG and LQD, which have had stellar performances this quarter.

This week, most of the Canadian banks report their earnings, so we will get a peek at how our neighbors north are fairing the slowing global economic conditions.

Monday: PVH Corp.
Tuesday: Bank of Montréal, Bank of Nova Scotia
Wednesday: Brown-Forman, Heinz, Joy Global, Pandora, Vera Bradley, Zale Corp.
Thursday: Royal Bank of Canada, Toronto-Dominion Bank
Friday: Cubic Corp, Frontline

I will be previewing Heinz, Joy Global, and Frontline

Heinz is the maker of ketchup, condiments and sauces, frozen food, soups, beans and pasta meals, infant nutrition and other food products. They do their business globally, but since they are a consumer staple, a company like this would be little affected by a global slowdown or any sort. Heinz just hit an all-time closing high Friday just above 56.00 with a p/e of about 20. They continue to see record revenue growth, though were hit by higher operating expenses last quarter which drove profit margin from 10% to 6%. I don't see any real concern here, seeing as they are probably onetime expense items.

In an uncertain environment as a long term investor, I generally look for growing companies with a safe dividend yield, and no better company than Heinz can fit that picture with a 3.66% dividend. They have also increased their divided by nearly 10% every year for the past 9 years, not suspending or decreasing it during '08. Even though this company continues to make all-time highs, the revenue growth is there, so this would be a great company to be buying long-term.


Above, a chart of Heinz with 50 and 100 SMA and MACD both looking bullish long term.

Next, Joy Global, which is a servicer of mining equipment for the extraction of coal and other minerals and ores. The Company's equipment is used in mining regions throughout the world to mine coal, copper, iron ore, oil sands, and other minerals. Seeing what has happened with coal stocks and this sector for the past year, this is not a name I would want to own. Although its P/E ratio is very low (about 8) I don't expect them to keep up with their earnings in the coming quarters. If Obama gets re-elected, which in my mind looks like it will happen, he will do anything possible to get consumers to use clean energy, limiting the amount of coal extraction needed for energy purposes. Although coal is not all they extract, so they are a very economically sensitive name, and seeing how manufacturing growth is slowing at a substantial rate, Joy is being hit with a double whammy.

Their revenues and income have been fairly stagnant for the past 4 reporting quarters, but the slowing is definitely there. Share prices are down almost 50% from the highs this March, don't be fooled into thinking this is a value trap because I believe we are going to be seeing some rough times ahead for this company.


Above, a chart of JOY, notice Death cross in April at the 2nd sell signal, then gapped down 20+ dollars from there, some momentum has picked up in August as the overall market has had a good month...so far.

Finally, Frontline, which is the owner of large crude tankers, has seen its share of dark days in the past year and a half, down 85%. This company is basically dead in the water, barely edging out a gain in their last reporting quarter. The problem here is a flooded supply of vessels, with slowing demand for oil. I was reading an article this past week on how future drilling techniques could extract oil at a faster rate. Putting this into perspective, that could flood the oil supply market when demand would still be the same, and still put pressure on the tankers.

They have lost a ton of money in one year and their equity positions are just about dried up, on enough they will have to sell off assets and some sort of bankruptcy will take place. I see no light at the end of the tunnel for Frontline, and for those of you who like to catch falling knives, good luck and wear some thick gloves.


Above is a 2 year chart of Frontline, long term investors have been hit pretty hard here.

Have a great week everyone, as for me, I will be focusing most of my time to looking at our schools stock portfolio, follow them on twitter @bonasimm we are a long-only equity money management team, with roughly $200K AUM.